// 02 — Climate Info
Temperature, rainfall,
and aridity
The Climate Info panel provides the long-term climate variables most relevant to
ecosystem distribution. It reports mean maximum and minimum temperature, annual
precipitation, aridity class, aridity index, and average dry months — all key
inputs for understanding the climatic envelope of an ecosystem.
Temperature and precipitation statistics are derived from
CHELSA (Climatologies at High Resolution for the Earth's Land Surface Areas),
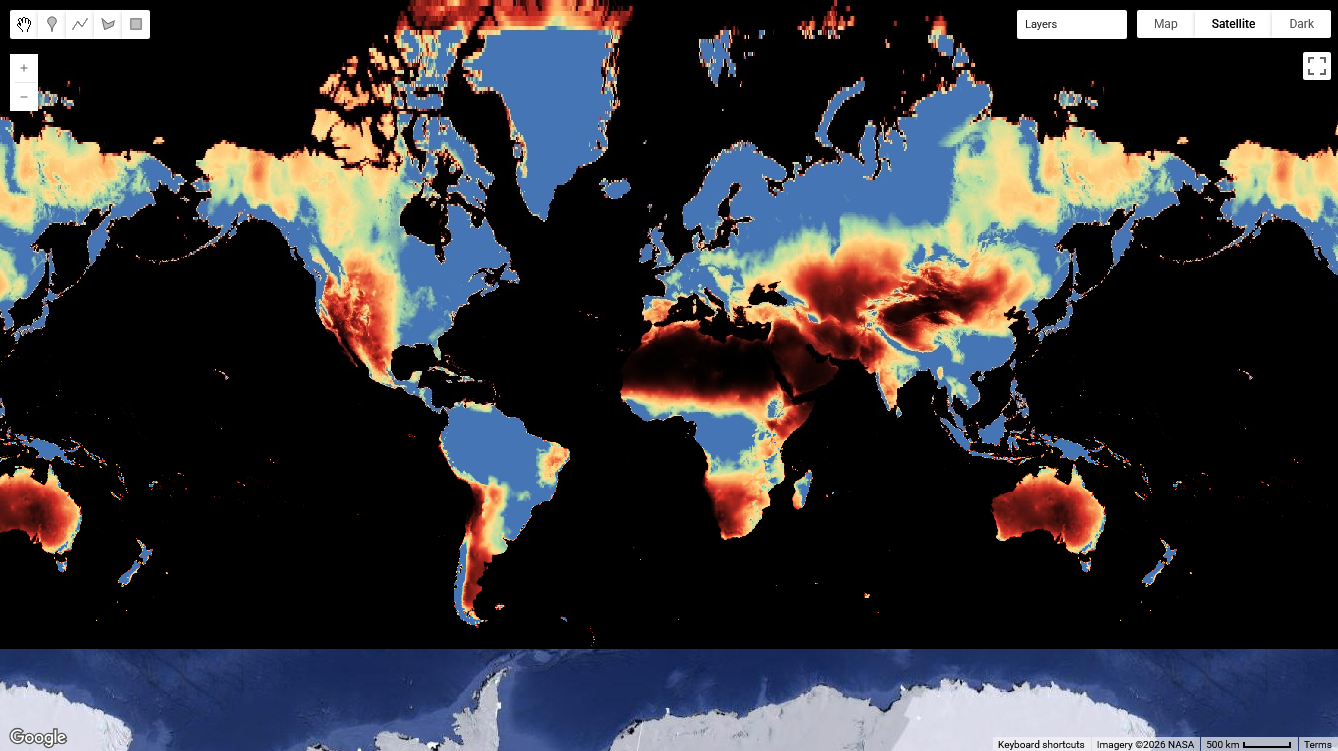
averaged across 1981–2010. The aridity index — the ratio of mean
annual precipitation to potential evapotranspiration — provides a numerical measure
of dryness: values below 0.03 typically indicate hyper-arid desert conditions.
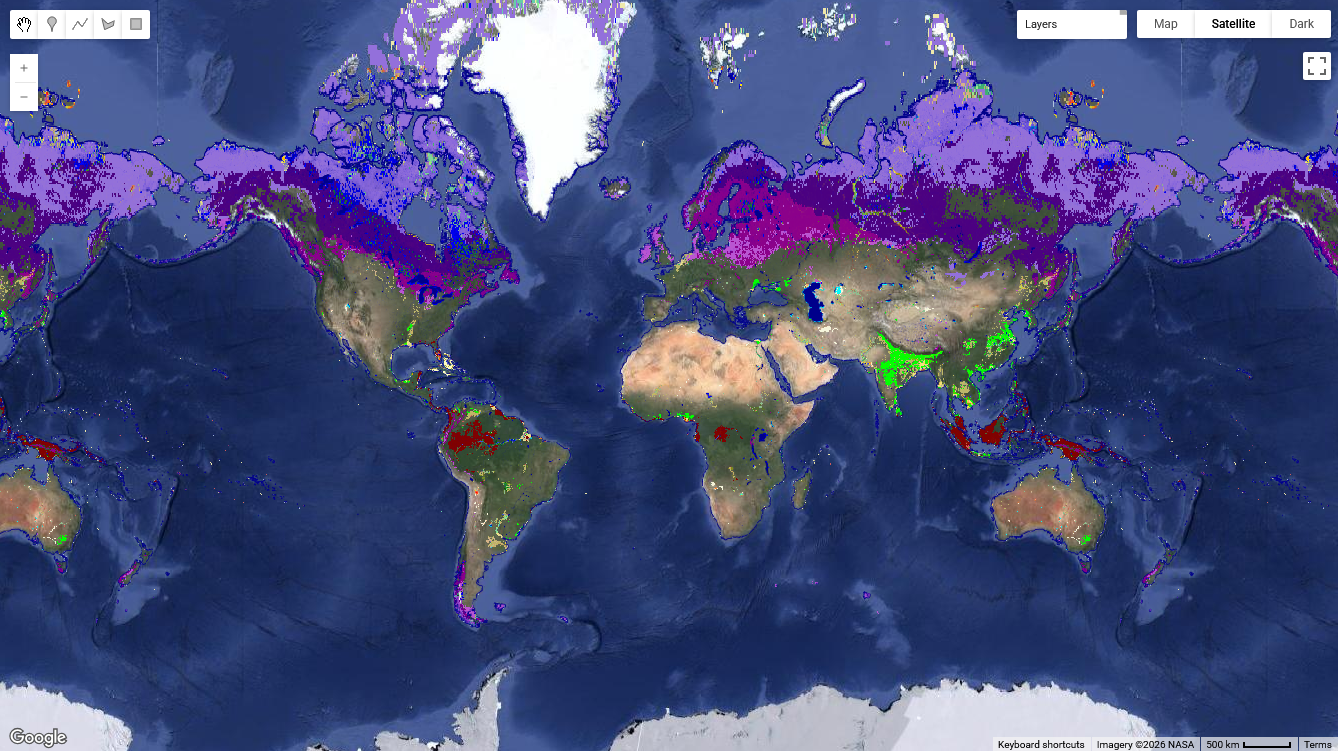
In colder climates, the panel additionally reports estimated snow days and flags
whether the location likely falls within the Polar and cryogenic biome. Users can
also generate interactive climate charts showing temperature and
rainfall trends over the last 10 years. The precipitation chart is derived from
CHIRPS (Climate Hazards Group InfraRed Precipitation with Stations),
a pentad-average dataset freely available in Google Earth Engine. The temperature
chart uses the ERA5-Land reanalysis dataset. These charts are
useful for understanding long-term trends in ecosystem condition and identifying
seasonal patterns — particularly when distinguishing fire-season dry periods
from wet-season recovery.
CHELSA High-Resolution Monthly Climate Data
Karger, D.N. et al. (2017) · Scientific Data
CC BY 4.0
CHIRPS Precipitation Pentad v2.0
Funk, C. et al. (2015) · Scientific Data
CC BY 4.0
ERA5-Land temperature
Copernicus Climate Change Service (C3S)
CC BY 4.0
Global Aridity Index & ET0 v3
Zomer, R.J. et al. (2022) · Scientific Data
CC BY 4.0